Introduction
I am sometimes asked to create data visualisations in a React Web app. The tool I normally reach for is D3.js. I use it in one of two ways. I might create the data visualisation entirely using D3. This includes using it to create and update the visualisation's DOM elements. Alternatively I might combine it with React, using D3 to calculate the positions of the DOM elements and React to actually render them. In this post I demonstrate this latter approach by recreating the D3 axis component in React.
The D3 axis component
The D3 axis component is familiar to any user of D3. It adds an axis to an SVG chart. The axis component is passed a D3 scale instance which defines the axis and is used to generate the tick position data. It can generate axes for linear, time, and ordinal scales. The axis can be positioned to the left, right, top or bottom of a chart.
An axis is formed from several parts. There is the line that represents the extent of the scale's domain. There are also two types of tick: inner and outer. Outer ticks are part of the domain line and mark its extent. The inner ticks mark each tick that is generated by the scale. Each inner tick consists of a line and a label (a <text> element).
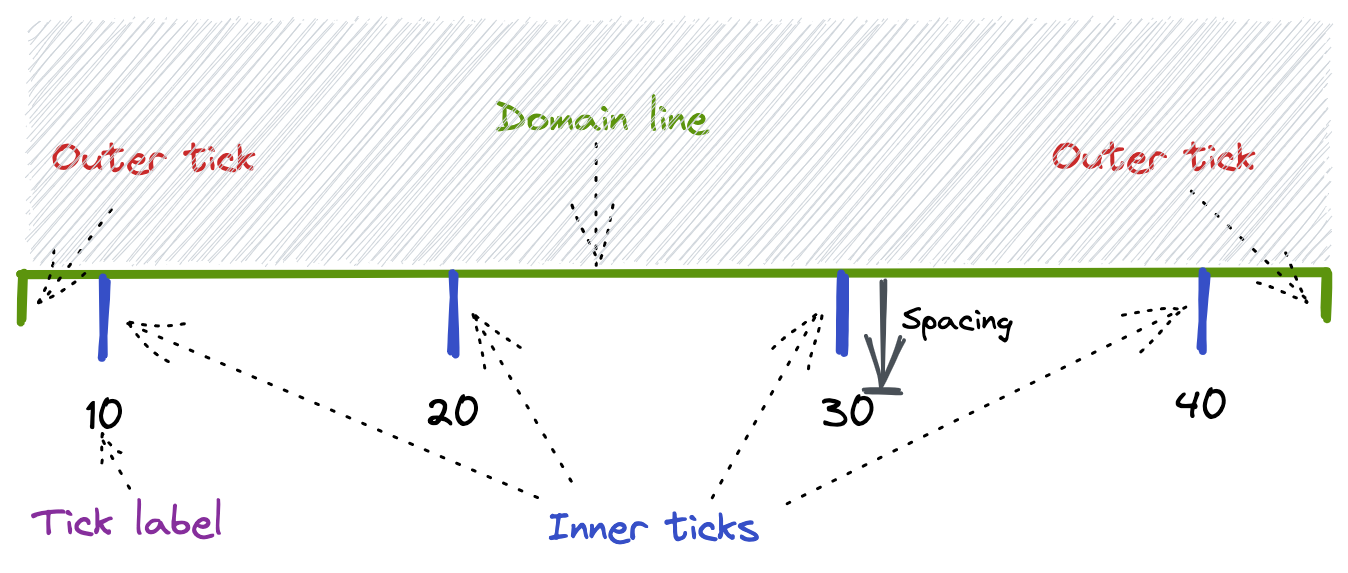
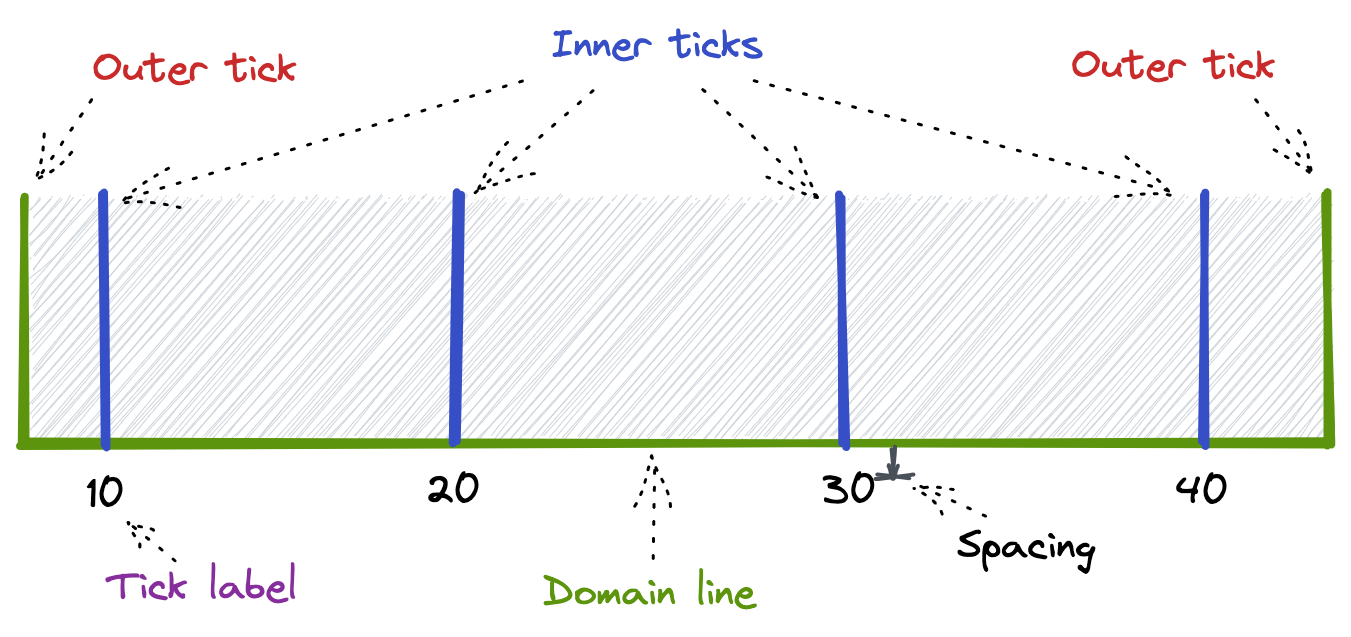
It is also possible to set negative values for the inner and outer tick size parameters. In that case, the ticks are drawn over the chart area instead of outside it:
You can alter the appearance of the axis elements by post-processing them, as demonstrated in this Observable file. You can also apply CSS styling by targeting the class names added to the axis.
The 'wow factor' for the axis component is how it animates when the scale is updated. Entering ticks appear from where they would have rendered according to the previous scale. Updating ticks animate smoothly to their new scale positions. Exiting ticks disappear to where they would have rendered according to the new scale.
To recreate the D3 axis component in React, we need to understand how it works. I created this heavily commented version of the axis component source code to help with this. The source code demonstrates a few useful D3 techniques. One of them is the following:
let path = selection.selectAll(".domain").data([null]);
Here we want to select a single child element of the selection with the class domain. We want to ensure that it is created if it does not already exist. This is done using a data join to an array of values that in fact consists of just a single null value. This is a neat technique when you need to select a single element that may or may not already exist in the DOM.
The axis source code also demonstrates a particular difficulty I have with D3. When I do data joins, I am often only entering, updating and exiting simple DOM elements. For example, when I generate the bars of a bar chart, I am only creating a single <rect> SVG element for each bar. I am not generating a subtree of SVG elements. But the D3 axis component requires a subtree of SVG elements for each inner tick. Each consists of a <g> element that has two children: a <line> element and a <text> element:
<g class="tick" opacity="1" transform="translate(0.5,0)">
  <line stroke="currentColor" y2="6"></line>
  <text fill="currentColor" y="9" dy="0.71em">0.0</text>
</g>
The data join occurs at the <g> element level:
let tick = selection.selectAll(".tick").data(values, scale).order();
With such subtrees, I find that the D3 code can quickly become a confusing series of enter selections, element creation, and merges with update selections. I think the D3 axis source code illustrates this well. I would worry about the maintainability of such code, although using comments to explain every step should help.
Recreating the D3 axis in React
I have two main reasons for recreating the D3 axis component in React.
Firstly, I find the declarative style of React code easier to create and maintain than the equivalent imperative D3 code. And if I want to only use React to render an SVG chart, then I am going to need a React alternative to the D3 axis.
Secondly, I have needed on more that one occasion to create a custom D3 axis. This has been when post-processing the D3 axis component was not sufficient. I find it easier to customize a React axis than a D3 axis.
The process of creating the React axis component is generally straightforward and is structured in much the same as the D3 version. A D3 scale instance is used to generate the tick data. It is also used to create a position function that is invoked to position each part of the axis. These are used to render the ticks, domain path and a containing group element. The problem is creating the animations, specifically the exit animations.
D3 makes animating charts incredibly easy. This includes the animation of exiting elements and their automatic removal when they complete their exit animations. This is much harder to achieve in React. React has no built-in way to delay the unmounting of a component until it completes an animation. The component is either rendered or it is not. Luckily there are React animation libraries that support animating exiting components. Internally, such libraries keep exiting components mounted until the animation completes. My library of choice for this is react-spring. By using the useTransition hook, the lifetime of the exiting ticks is extended until they complete their exit animations. The only trickiness is the need to keep a reference to the previous positioning function, so it can be used to animate entering ticks when the axis is next rendered.
You can see the result in the first section of this Web page. For each of the scale types of continuous, time and ordinal, I have rendered a D3 axis and its equivalent React version. You can use the update buttons to test them out. The code for the React axis component can be viewed here.
(I did originally use Framer Motion for the React axis animations. I found that it was slower to begin animating compared to the D3 axis. This lag was greatly reduced by switching to react-spring.)
A significant difference in behavior between the D3 and React axes occurs when the animation is interrupted. You can see this further down that page, in Example 4. The ticks animate differently in the D3 and React axes when the animation is interrupted. In the React axis, the negative value ticks fly off to the right. In the D3 axis, they stop and reverse direction.
The problem is with the exiting ticks. When the update button is clicked, several ticks start to exit. Then when the update button is quickly clicked again to interrupt the animation, some of those exiting ticks are in the new scale and need to be 'resurrected'. The rest of the ticks continue to exit. The problem is with the ticks that continue to exit. With the D3 axis, their animations are updated so that they now move towards the positions they would be on the new scale. But react-spring does not include a way to update exit animations after they have started. As a result, the exiting ticks continue to move according to their old scale positions, which means that they tend to fly off the chart.
Regardless, I do not think the issue is actually very important. I can only really see the problem if I run the animations at a much slower speed than normal. Also, even the D3 axis component does not behave perfectly with interruptions. I was sometimes able to cause unexpected animations of some of the exiting ticks.
Conclusion
The react-spring library is excellent for animating data visualisations that are rendered using React. I was able to use it to create a React-rendered version of the D3 axis component. The techniques used to create the React axis should translate well to the other chart components, such as the bars in a bar chart. I did find an issue with how exiting components animate when the transition to a new state is interrupted, but the issue is unlikely to be of concern in normal usage.
Changelog
- 2021-12-30 Initial version
- 2022-06-21 Minor rewordings
# Comments
Comments on this site are implemented using GitHub Issues. To add your comment, please add it to this GitHub Issue. It will then appear below.